Did you know you can add dynamic images to snippets?
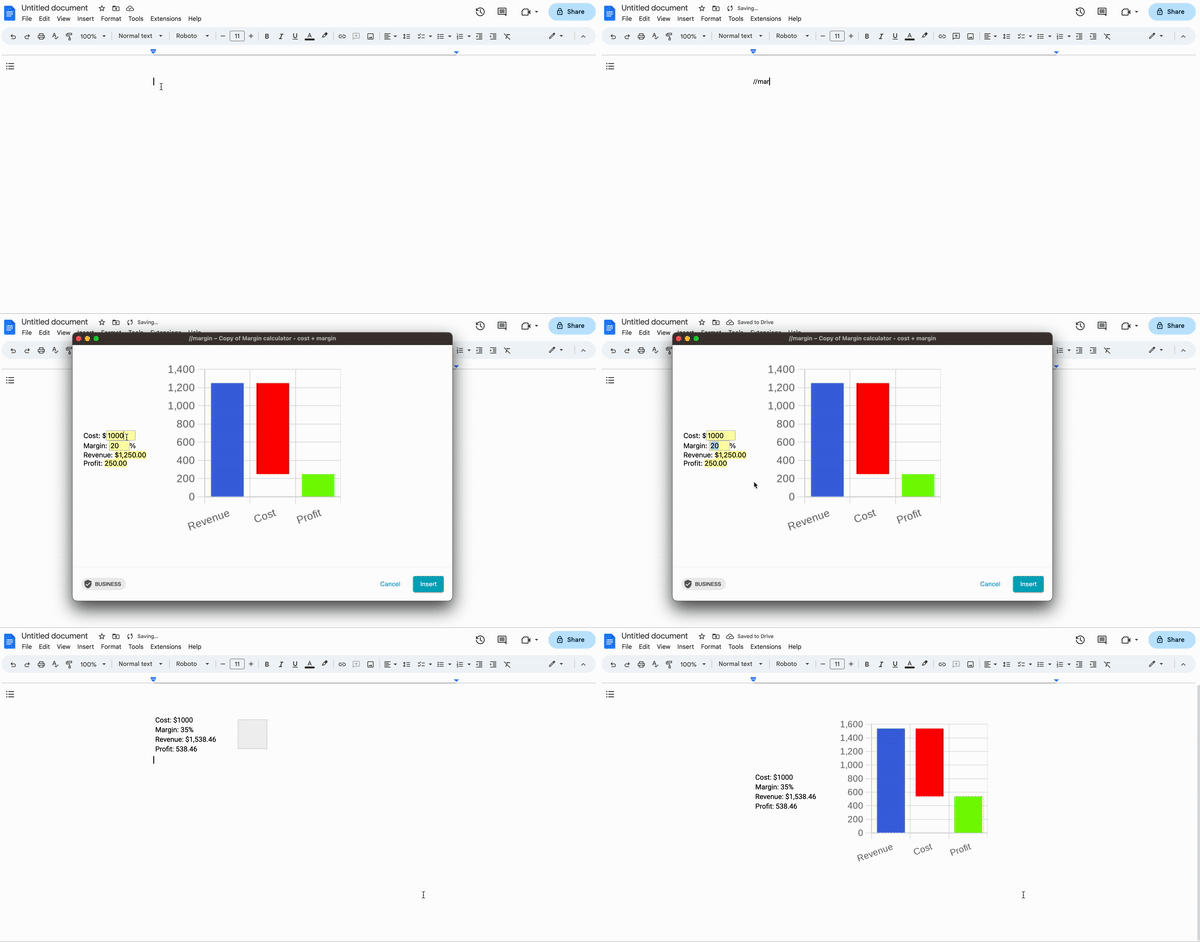
Here is a simple profit margin calculator with a dynamic graph. It takes as input the cost and the required profit margin and calculates the target revenue using the formula: revenue = cost / (1-margin)
Quickchart is an online API that creates dynamic graph images. In this snippet, I use the {image} command to generate a quickchart graph with information from the snippet. When the information changes, the graph will be updated accordingly.
We can't preview the image command, so I've attached a screenshot below.
Currently, creating these kinds of dynamic images requires technical knowledge. We plan to make it much easier soon. If you have a need for something like this, please reach out and we'll be happy to help: support@blaze.today.

Cost: ${formtext: name=cost; default=100}
Margin: {formtext: name=margin; default=20; cols=4}%
Revenue: {=revenue; format=$,.2f}{revenue=cost/(1 - margin/100)}
Profit: {=profit; format=$,.2f}{profit=revenue-cost}
{formtoggle: name=Show graph; default=yes}
{image: https://quickchart.io/chart/chart?width=300&height=150&v=3&c={ type: 'bar', data: { labels: ['Revenue', 'Cost', 'Profit'], datasets: [{ data: [{=revenue}, [{=profit},{=revenue}],{=profit}], backgroundColor: ['rgba(65,105,225)','rgba(255, 0, 0)','rgba(124,252,0)']},],}, options: {plugins: {legend: {display: false,},},scales: {y: {ticks: {beginAtZero: true,},},},},} }{endformtoggle}
This snippet is also available in the gallery